How to measure IT automation savings: time saved, cost saved, and labor rate
Published
IT automation savings are the hours your team stops spending on requests that automation now handles, multiplied by what an hour of support work actually costs. Measuring them takes three steps: count what automation resolved and ran, turn that into time, and apply a labor rate your finance team will accept. Serval does the counting on every team's Analytics page, so you can report hours and dollars saved by team without keeping a spreadsheet.
What should you measure to prove IT automation savings?
Four numbers prove IT automation savings: AI-resolved tickets, workflow runs, estimated time saved, and estimated money saved. AI-resolved tickets are requests Serval finished with nobody involved. Workflow runs are the automated actions behind them, like resetting a password or creating an Okta account, and they count even when a person closes the ticket. Estimated time saved turns both into hours, and estimated money saved puts a dollar figure on those hours.
Watch time to resolve, SLA compliance, and requester feedback next to them. If savings go up while feedback goes down, automation is closing tickets people still needed help with, and those savings aren't real.
Only count requests automation actually completed. Getting a ticket to the right person faster helps, but that person still spends the time, so it stays out of the savings math. There's more on this in our post on automation versus deflection.
Once savings are measurable, they also change what IT gets judged on. SeatGeek's Senior Manager of Business Technology put it this way: "Our IT Engineers will no longer be focused on tickets closed or CSAT or TTR. They'll be focused on revenue generation, days saved during accounting close, and dollars saved on SaaS elimination instead."
How does Serval calculate time saved and money saved?
Serval counts 10 minutes for each AI-resolved ticket and 5 minutes for each additional workflow run, then multiplies the total by a labor rate of $100 per hour.
Take a large IT team that, in one month, has 3,000 tickets resolved by AI and 6,000 additional workflow runs:
| Activity | Volume | Time saved each | Time saved |
|---|---|---|---|
| AI-resolved tickets | 3,000 | 10 minutes | 500 hours |
| Additional workflow runs | 6,000 | 5 minutes | 500 hours |
| Total | 1,000 hours |
That's 1,000 hours, or $100,000 at $100 an hour. If your fully loaded cost is closer to $60 an hour, the same month is worth $60,000.
Automation rates can climb quickly. SeatGeek went from 0% to 40% automation in its first three weeks on Serval and passed 50% within 60 days.
How do you apply your own labor rate?
Use fully loaded cost, not salary. Add benefits, payroll taxes, tools, management overhead, and whatever you pay contractors or outsourced support, then divide by the hours your team actually works in a year.
Two things make the number harder to argue with. First, price the work at the level of whoever used to do it. If automation mostly took password resets off L1, use an L1 rate. If L2 engineers got time back too, blend the two. Second, settle the rate with Finance before you present anything, so the meeting is about the savings and not about your math.
You can also see savings at your own rate inside Serval. Ask Catalyst for a custom dashboard widget that multiplies hours saved by your labor rate, and it builds the widget and the workflow behind it for you to review and publish.
If you're still building the case for automation, start with how to quantify IT automation ROI. This post is about measuring what you saved once automation is running.
How do you track hours saved per team and per month?
Each team in Serval has its own Analytics page, so IT, HR, and every other team see their own resolved tickets, workflow runs, time saved, and money saved. Org admins get an organization-level view on top of that. The time saved and money saved figures are lifetime totals for the team, and you can narrow them to one or more assignment groups.
For a month-by-month view, build a custom dashboard. Ask Catalyst for a widget that charts time saved and money saved by month, using the same 10-minute and 5-minute estimates and your own labor rate. Filter it by ticket type, priority, or label if you want the savings for one kind of request. Catalyst writes the workflow behind the widget, and you review and publish it. Star the dashboard or pin it to your sidebar so it's one click away at month end.
The built-in tickets chart already shows the trend. It splits tickets into AI resolved, AI assisted (Serval ran workflows and a person finished), Unassisted (escalated with no workflows run), and Resolved outside Serval, and you can set its granularity to Monthly. The AI-resolved share is the one to watch month over month, and you can export the tickets CSV for leadership or your BI tool.
How do you find which requests cost the most time before automating?
Serval shows you what automation isn't touching yet. Filter Analytics for Unassisted tickets to see which request types Serval escalates most often. Those are your best candidates for new workflows.
You don't have to do that review by hand. When Serval identifies an automation opportunity in a ticket your team resolved manually, it creates an AI suggestion for you to review, such as a new workflow, a new skill, or a knowledge update. The Automation Opportunity Finder, an installable background agent, goes further. Every week it reviews recent tickets for repetitive, manual requests with no coverage and drafts the top workflows and help desk skills for you to review and publish. The Ticket Trend & Volume Analytics agent, also weekly, tracks week-over-week ticket volume by category and surfaces the most common and critical failure patterns.
Can you track savings across help desk, access, and assets in one place?
Yes. Serval's custom dashboards can pull tickets, access requests, assets, and workflow runs into one view, plus data from connected apps like ServiceNow or GitHub. You describe what you want, Catalyst designs the widgets and writes the workflows behind them, and you review and publish.
Licenses are worth tracking too. The Proactive License Reclamation agent, another installable background agent, runs weekly. It finds unused application licenses, reports the savings, and drives reclamation through your deprovision workflows. See automated license reclamation for how that works.
The short version
IT automation savings are time saved multiplied by a labor rate you can defend. Serval tracks the time on every team's Analytics page, at 10 minutes per AI-resolved ticket and 5 minutes per additional workflow run, so you can report hours and dollars saved by team, build a monthly view with a custom dashboard, and see which requests to automate next.
FAQ
How is time saved calculated in Serval?
Serval estimates 10 minutes saved for each AI-resolved ticket and 5 minutes for each additional workflow run, based on how long a support agent typically spends on similar tasks. Total time saved shows up on each team's Analytics page.
How do you track hours saved by AI per team?
Each team in Serval has its own Analytics page showing AI-resolved tickets, workflow runs, estimated time saved, and estimated money saved as lifetime totals, which you can narrow by assignment group. Org admins also get an organization-level view. For hours saved by month, build a custom dashboard widget with Catalyst.
Can you customize the labor rate used to calculate automation savings?
Yes, with a custom dashboard. The Analytics page estimates money saved at a standard rate of $100 per hour. To use your own fully loaded rate, ask Catalyst to build a custom dashboard widget that multiplies hours saved by your rate. Catalyst writes the workflow behind the widget for you to review and publish.
You may also be interested in

Sam Stewart joins Serval as Head of Security
Sam Stewart will lead security at Serval as its AI agents take on more of the enterprise's most sensitive work.
Company
The Rise of the Automation Engineer
The job that didn't exist two years ago, and why every company will need one.
Company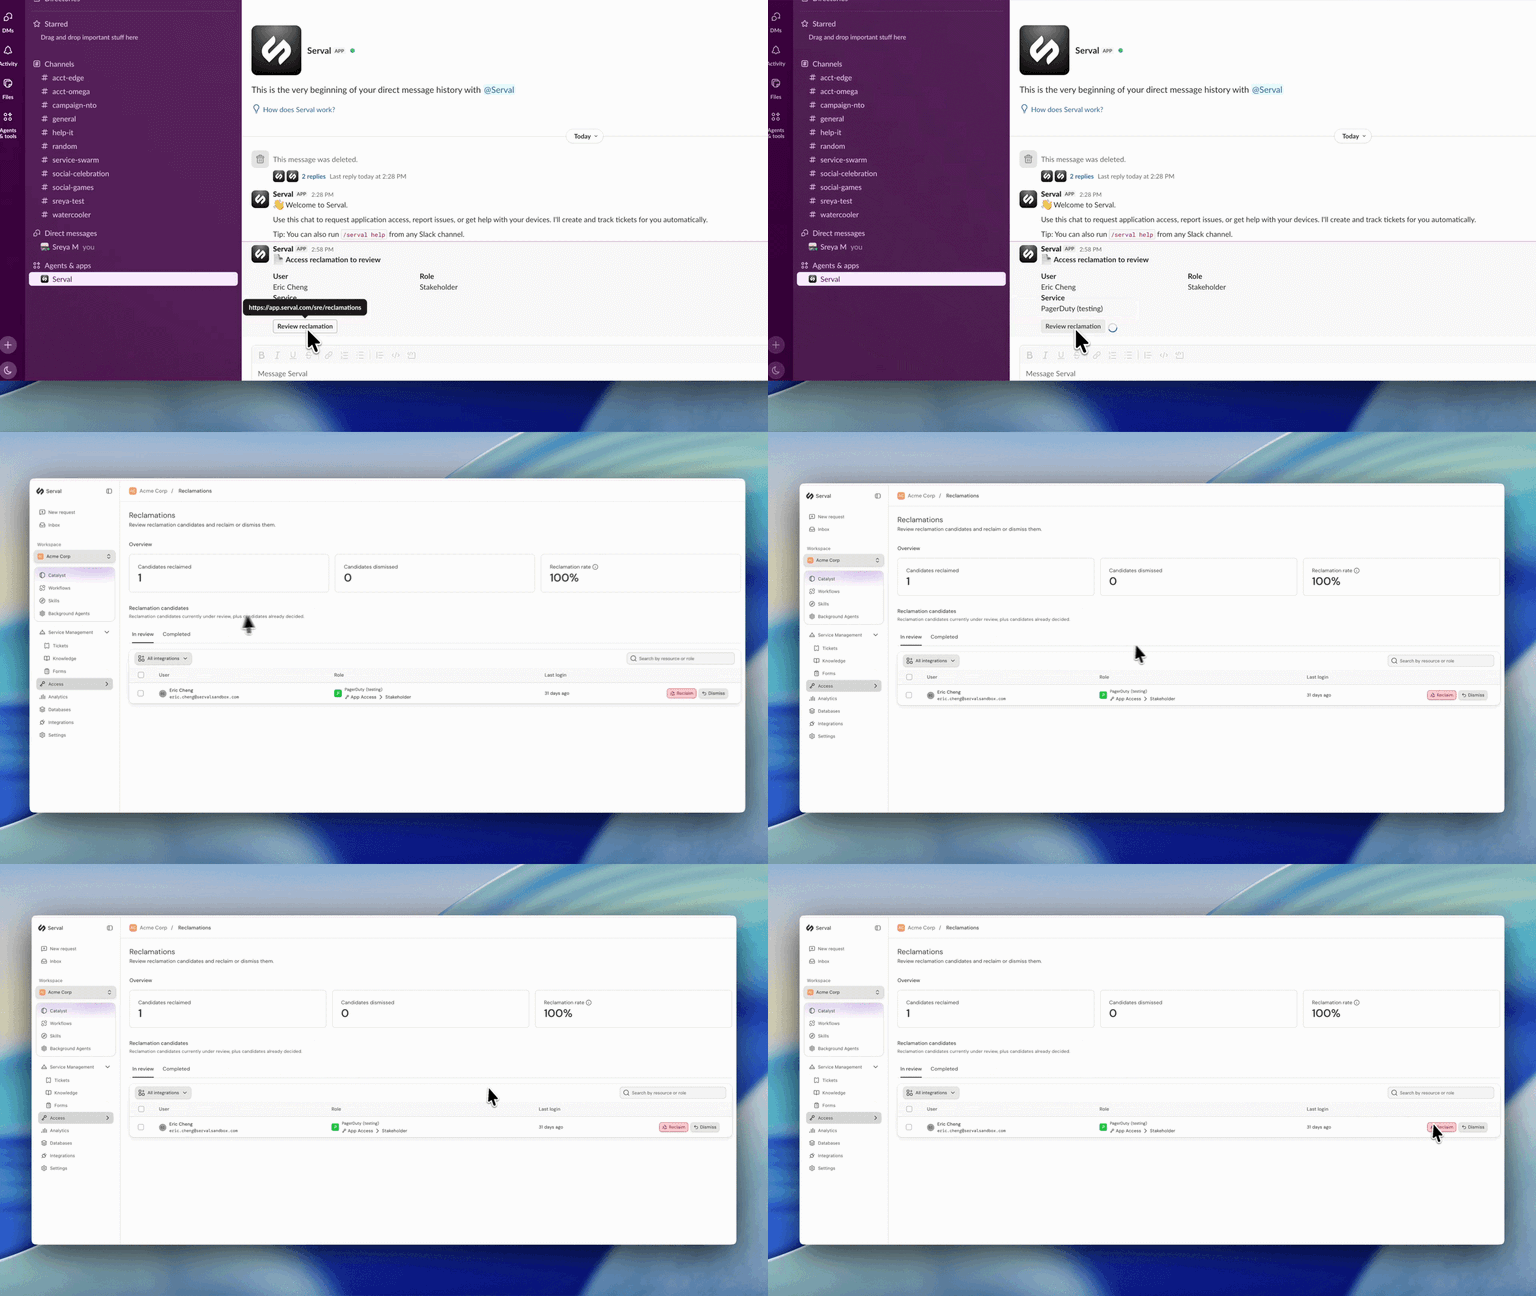
Introducing automated license reclamation
Serval reclaims seats as they go unused, on a policy you set once.
Product